


Business volume up 15.6% in the first half of the year
Earnings before tax increase by 16.2%
Broad-based growth across all segments and customer groups
Orders
Bechtle enters into both short-term and longer-term contracts with customers across our product and service offering. Our infrastructure business is dominated by product sales with short order-to-delivery times. By contrast, service projects usually last from several weeks to a year, while framework and operating agreements for managed services and cloud computing generally run for several years.
In the first half of 2026, incoming orders amounted to €4,826 million, up 21.1% on the prior-year figure (€3,984 million). As of 30 June, the order backlog reached a new record level of €3,535 million, up 10.1% compared with 31 December 2025 (€3,210 million).
Business volume
Business volume increased by 15.6% to €4,501.3 million over the first six months of 2026. The increase also reflects last year’s acquisitions in the Netherlands, Spain and Italy, as well as the acquisitions in Portugal and Hungary that were completed during the first half of 2026. Organic growth was also strong at 11.9%. This performance was broad-based across all segments and customer groups. Following an already very strong first quarter, the second quarter delivered even higher growth rates, carried in part by a significant increase in hardware prices. From April to June, business volume grew by 18.1%, while organic growth alone was 12.9%.
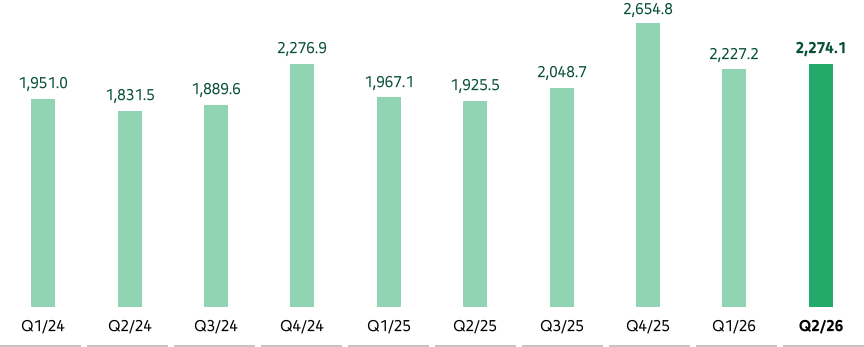
All segments contributed to this growth in the first half of the year, with increases of 9.7% in Germany, 10.4% in France and 11.9% in Benelux. Other Europe delivered the strongest growth, with business volume increasing by 40.1%. While acquisitions completed over the past twelve months contributed to this performance, the segment also achieved organic growth of a very strong 19.7%.
|
|
H1/2026 |
|
H1/2025 |
|
Change in % |
|
Q2/2026 |
|
Q2/2025 |
|
Change in % |
|---|---|---|---|---|---|---|---|---|---|---|---|---|
Group |
|
4,501,326 |
|
3,892,604 |
|
15.6 |
|
2,274,149 |
|
1,925,471 |
|
18.1 |
Germany |
|
2,386,813 |
|
2,176,211 |
|
9.7 |
|
1,215,905 |
|
1,101,259 |
|
10.4 |
France |
|
421,573 |
|
381,831 |
|
10.4 |
|
208,033 |
|
187,952 |
|
10.7 |
Benelux |
|
701,971 |
|
627,266 |
|
11.9 |
|
317,472 |
|
283,361 |
|
12.0 |
Other Europe |
|
990,969 |
|
707,296 |
|
40.1 |
|
532,739 |
|
352,899 |
|
51.0 |
Revenue
Revenue increased by 12.1% to €3,303.9 million over the first half of 2026 (prior year: €2,948.2 million). Growth was slower than that recorded for business volume due to the higher share of software business, which is not fully recognised as revenue. In the second quarter, revenue rose by 16.5%. Organic growth amounted to 7.8% over the first half of the year and 10.3% in the second quarter.
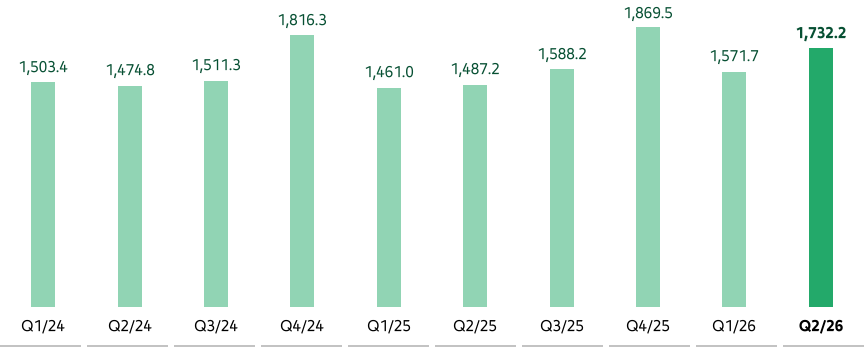
All regions recorded revenue growth in the first half of the year, although the increase was more modest in Germany and France, where software accounted for a larger share of business volume, at 5.6% and 4.9% respectively. Benelux and Other Europe, by contrast, translated their double-digit business-volume growth into revenue growth of 12.7% and 36.4% respectively, with the latter benefiting significantly from acquisitions. Organic growth in that segment, however, was also very strong at 13.0%.
|
|
H1/2026 |
|
H1/2025 |
|
Change in % |
|
Q2/2026 |
|
Q2/2025 |
|
Change in % |
|---|---|---|---|---|---|---|---|---|---|---|---|---|
Group |
|
3,303,889 |
|
2,948,214 |
|
12.1 |
|
1,732,198 |
|
1,487,178 |
|
16.5 |
Germany |
|
1,833,922 |
|
1,736,240 |
|
5.6 |
|
962,555 |
|
871,402 |
|
10.5 |
France |
|
326,758 |
|
311,431 |
|
4.9 |
|
151,663 |
|
152,465 |
|
−0.5 |
Benelux |
|
404,442 |
|
358,974 |
|
12.7 |
|
215,731 |
|
192,525 |
|
12.1 |
Other Europe |
|
738,767 |
|
541,569 |
|
36.4 |
|
402,249 |
|
270,786 |
|
48.5 |
Business volume per employee increased to €307 thousand in the first half of the year (prior year: €278 thousand). Revenue per employee amounted to €225 thousand in the first half of the year (prior year: €211 thousand).
Earnings
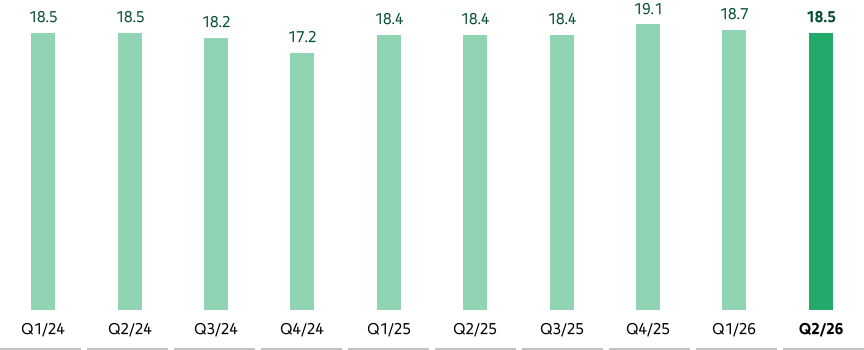
Gross profit increased slightly faster than revenue in the first half of the year, rising 13.2% to €614.4 million. The gross margin improved slightly to 18.6% (prior year: 18.4%). Cost of sales increased by 11.8%. While the cost of materials rose slightly faster than revenue, increasing by 13.0%, personnel expenses went up by just 3.4%, with depreciation and amortisation, and other operating expenses growing broadly in line with revenue. Performance in the second quarter followed a similar pattern, although the movements were more pronounced due to stronger revenue growth.
Selling expenses increased at a slower rate than revenue in the first half of the year, rising 10.1% to €253.0 million. The largest increase was recorded in personnel costs, particularly in variable compensation. The ratio declined slightly to 7.7% (prior year: 7.8%). Administrative expenses rose in line with revenue, increasing 13.1% to €236.1 million, with the ratio unchanged at 7.1%. The increase was broadly consistent across the underlying cost items. Other operating income increased from €21.4 million to €24.0 million due to higher marketing allowances.
EBITDA increased by 15.7% to €234.2 million in the first half of the year, with the margin improving slightly from 6.9% to 7.1%. In the second quarter, EBITDA rose by 18.8% to €126.7 million, while the margin increased to 7.3% (prior year: 7.2%).
Depreciation and amortisation increased by 10.5% to €84.9 million in the first half of the year, reflecting acquisitions completed over the past twelve months and increased investment in the previous year. Depreciation of property, plant and equipment continued to account for the largest share, amounting to €70.0 million in the first half of the year. Amortisation arising from acquisitions amounted to €15.0 million (prior year: €12.3 million).
EBIT increased by 18.9% to €149.2 million, with the margin improving slightly to 4.5% (prior year: 4.3%). In the second quarter, EBIT rose by 23.0% to €84.1 million.
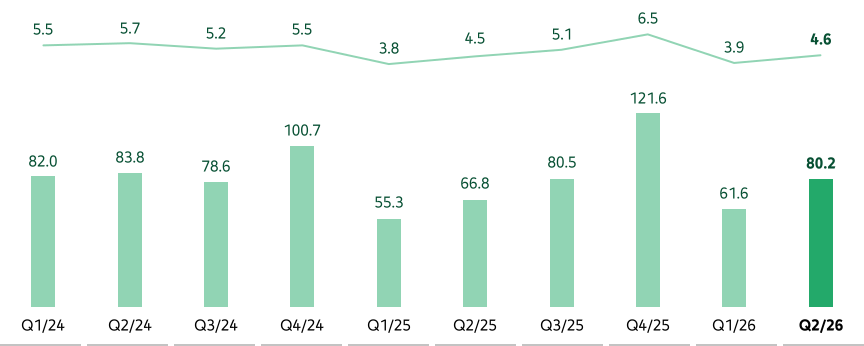
The group’s EBT increased by a strong 16.2% to €141.8 million in the first half of 2026 (prior year: €122.1 million). The EBT margin increased to 4.3%, compared with 4.1% in the prior year. In the second quarter, EBT amounted to €80.2 million, up 20.1% year on year, while the EBT margin improved slightly from 4.5% to 4.6%.
Tax expense increased by 9.1% to €39.6 million during the reporting period. The tax rate declined to 27.9%, compared with 29.7% in the prior year. Earnings after tax attributable to Bechtle AG shareholders increased by 18.8% to €102.8 million. Based on 126 million shares, earnings per share (EPS) amounted to €0.82 (prior year: €0.69). In the second quarter, EPS was €0.46 (prior year: €0.38).

By segment, earnings performance was as follows.
Overall, earnings performance across the segments was very strong. In Germany, EBIT increased by 8.3% to €94.4 million, while the margin edged up to 5.1%. In France, the EBIT margin improved from 2.2% to 2.7%, with EBIT rising to €8.7 million. Despite ongoing market challenges, initiatives launched last year are beginning to gain traction. In Benelux, the margin remained stable at 3.9%, while EBIT increased to €15.7 million. Other Europe delivered particularly strong growth, with EBIT rising by 72.0% to €30.5 million, also reflecting the impact of acquisitions, while the margin improved from 3.3% to 4.1%.
|
|
H1/2026 |
|
H1/2025 |
|
Change in % |
|
Q2/2026 |
|
Q2/2025 |
|
Change in % |
|---|---|---|---|---|---|---|---|---|---|---|---|---|
Group |
|
149,234 |
|
125,522 |
|
18.9 |
|
84,055 |
|
68,365 |
|
23.0 |
Germany |
|
94,371 |
|
87,102 |
|
8.3 |
|
55,660 |
|
51,721 |
|
7.6 |
France |
|
8,677 |
|
6,711 |
|
29.3 |
|
3,146 |
|
2,086 |
|
50.8 |
Benelux |
|
15,671 |
|
13,968 |
|
12.2 |
|
7,557 |
|
6,812 |
|
10.9 |
Other Europe |
|
30,515 |
|
17,741 |
|
72.0 |
|
17,692 |
|
7,746 |
|
128.4 |